The real estate agent performance report: 8 key numbers, the formula for each, and how to read them
A real estate agent's performance report rests on eight numbers that follow a lead from first message to commission: average response time, contact rate, viewings, offers, closing rate, commission earned, overdue follow-ups and return on each lead source. The first numbers measure effort and speed, the last ones measure results and profitability, and reading them together shows exactly where each agent gets stuck.
Last updated:
Why eight numbers and not just sales?
Most managers judge agents by deal count or commission at month end. That number matters, but it arrives late: a property deal can take weeks or months, and by the time weak sales show up it's too late to fix the cause. It also doesn't tell you the cause: is the agent slow to reply? Do they reply but fail to turn chats into viewings? Do they reach offers but not close?
The eight numbers in this guide follow the client journey. Each one measures a stage, and each stage feeds the next. Read the report in that order and you'll find each agent's leak point and know exactly what to coach, instead of generic advice like "work harder".
The eight numbers and their formulas
Calculate every number for the same period (a week or a month), per agent and then for the whole team. Don't set targets from figures published for other markets; measure your own agency's numbers for two months first, then set targets as gradual improvements on them.
| KPI | Formula | What it reveals |
|---|---|---|
| 1. Average response time | Sum of (first contact time − lead arrival time) ÷ number of leads | How fast the agent is when it matters most |
| 2. Contact rate | Leads actually spoken with ÷ leads received × 100 | Whether the agent reaches leads or gives up after one try |
| 3. Viewings | Viewings completed; rate = viewings ÷ contacted leads × 100 | Ability to turn a conversation into a meeting |
| 4. Offers | Offers made; rate = offers ÷ viewings × 100 | How well units are matched and negotiated |
| 5. Closing rate | Deals closed ÷ leads received × 100 (or ÷ offers for the final stage) | Overall efficiency from lead to deal |
| 6. Commission | Sum of the agent's share of commission on deals closed in the period | The agent's real financial contribution |
| 7. Overdue follow-ups | Follow-up tasks past due and not done + open leads with no recent contact | Daily discipline and leads at risk |
| 8. Source ROI | (Commission revenue from source − source cost) ÷ source cost × 100 | Where marketing spend should grow or shrink |
Response time and contact rate: two numbers that drive everything after
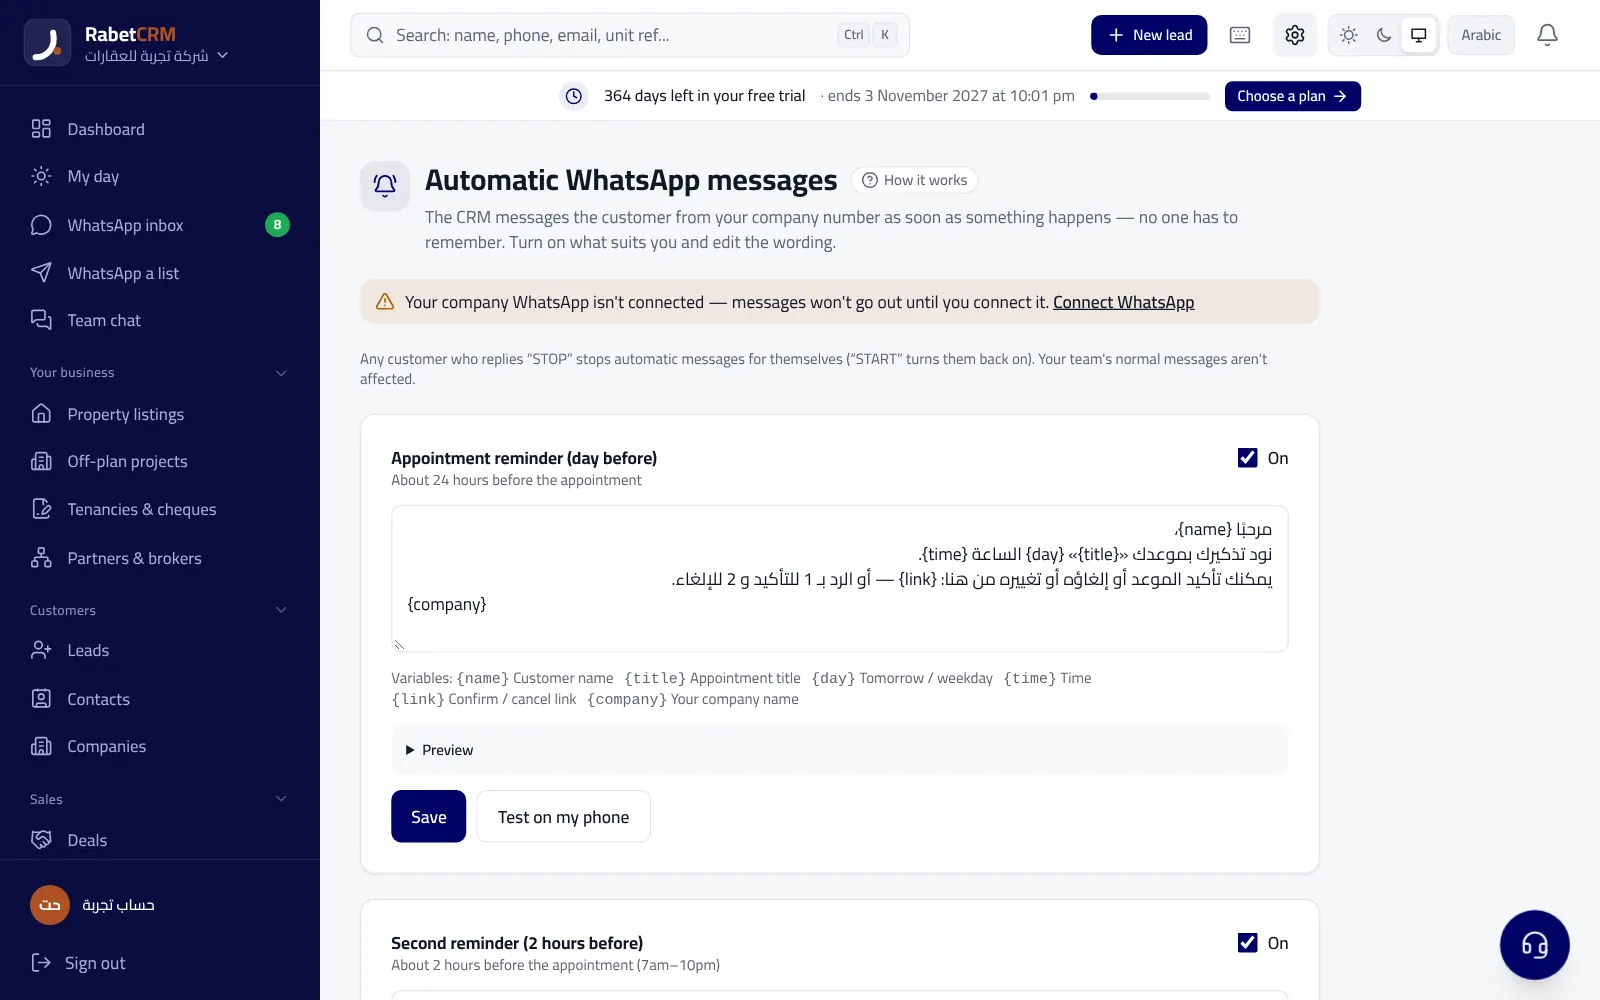
Response time comes first because a UAE property client usually contacts several agencies at once. Measure it from the moment the lead enters the system to the agent's first real contact, not to the automatic welcome. Beware the misleading average: an agent who answers nine leads within minutes and leaves the tenth for a whole day can look fine on average. So also review how many leads exceeded the time limit in your routing rule, as explained in automatic lead distribution.
Contact rate measures how many leads the agent actually spoke with, not how many times they tried. A lead who didn't answer the first call needs a second attempt at a different time and a useful WhatsApp message. An agent with a low contact rate usually stops after one try, and the fix is training on a clear follow-up cadence, not more leads.
Viewings and offers: from conversation to commitment
A viewing is the first proof that a client is serious, and the ratio of viewings to contacted leads measures the agent's qualifying skill: do they ask about budget, area, move-in date and payment method, then suggest units that genuinely fit? A low ratio usually means the agent sends long lists without qualifying, or the leads come from a weak source.
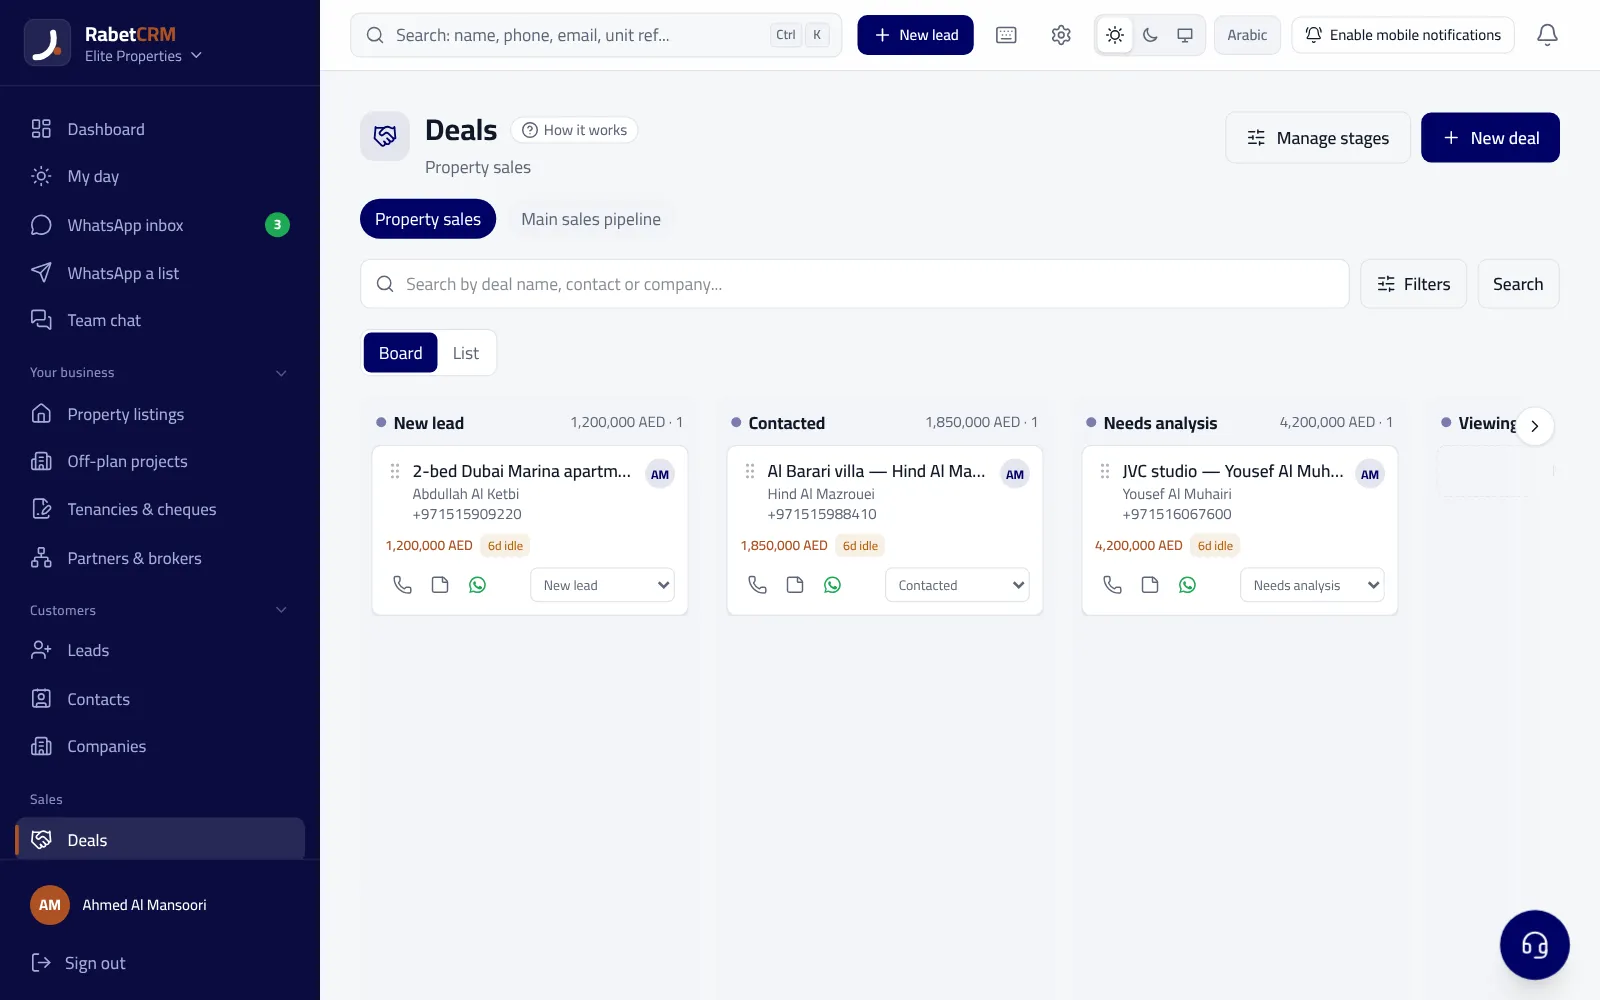
Offers are measured against viewings. An agent who runs many viewings but gets few offers may be choosing the wrong units, may not know how to ask for a decision, or may hesitate to negotiate with the owner. Log every viewing and every offer in the system as a deal stage, so these numbers calculate themselves instead of relying on the agent's memory at the month-end meeting.
Closing rate and commission: the bottom line
Closing rate from leads received is the single best number for comparing agents, provided they received leads from similar sources. Don't compare a leasing agent with a luxury-villa agent; compare each agent with themselves over the months, and with colleagues handling the same kind of leads. To measure only the final stage, calculate closings as a share of offers.
Commission is the number that matters to both the agent and the company. Count the agent's share after any co-broker split, and separate commission earned from commission actually collected: a closed deal whose commission hasn't been paid isn't income yet. To work out splits quickly, use the commission calculator.
Overdue follow-ups: the number that predicts the future
If you want one number that predicts next month's sales, look at overdue follow-ups. Every follow-up task past its due date, and every open lead not contacted for days, is a potential deal going cold. An agent whose overdue follow-ups pile up will struggle later, however good their current numbers look.
Review this number daily or weekly, not monthly, and ask agents to start each day by clearing it. If one agent's count is very high, they may be receiving more leads than they can handle, and the fix is adjusting distribution, not blame.
- Tasks past their due date and not completed
- Open leads with no contact for several days
- Leads after a viewing with no next step logged
- Upcoming installments or cheques with no client reminder
Return on each lead source
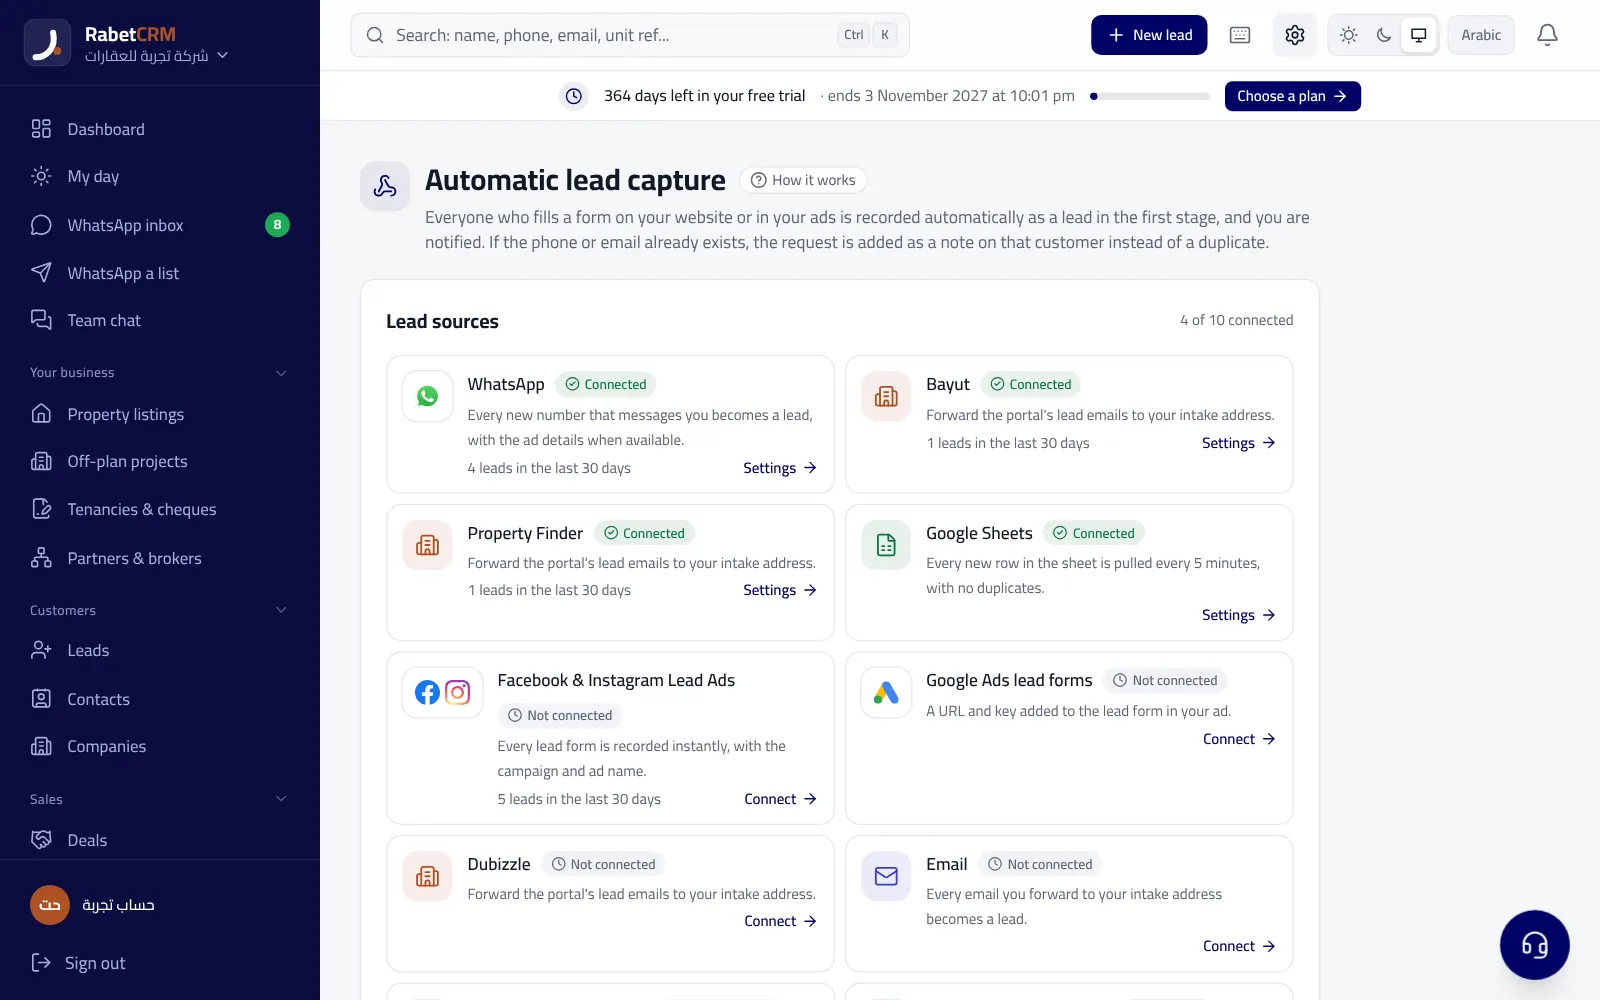
A brokerage usually pays for several sources: portal subscriptions, Facebook, Instagram and Google ads, and maybe events or partners. Source ROI answers a simple question: how much did we earn for every dirham spent here? Take the source's cost for the period, then the total commission from deals that came from it, and apply the formula in the table above.
Watch two things. First, property deals lag, so this month's campaign may show its return in two or three months; review ROI over a longer window. Second, the number depends entirely on recording every lead's source accurately from the start; a lead with no source drops out of the calculation. To compare the portals themselves, see Bayut vs Property Finder vs Dubizzle.
The monthly review: clean data and a fair discussion
A performance report is only as good as the data behind it. If agents call from their own phones without logging calls, or move a lead to the viewing stage a week after it happened, the numbers will mislead you and may be unfair to a hard-working agent. So agree on simple, clear logging rules with the team before you start comparing, and give them a month to get used to them without consequences.
The point of the report is improvement, not punishment. Start the meeting with the whole team's numbers, then go agent by agent, and pick just one number for each agent to improve next month. A slow responder trains on fast replies; an agent with many viewings and few offers trains on qualifying and negotiation. Share numbers openly: agents accept feedback more readily when it's based on data everyone can see. Close the meeting by agreeing one practical step per agent — a reply-training session, or shadowing a senior agent on two viewings — then check its effect at the next meeting using the same numbers, so the team sees the report as a tool for growth, not just accountability.
- Every lead has a source and an owner from the moment it arrives
- Every important call or message is logged on the lead the same day
- Viewings and offers are logged as deal stages as they happen
- Closed deals are recorded with value, commission and split
- Lost leads are closed with a lost reason
These numbers in RabetCRM
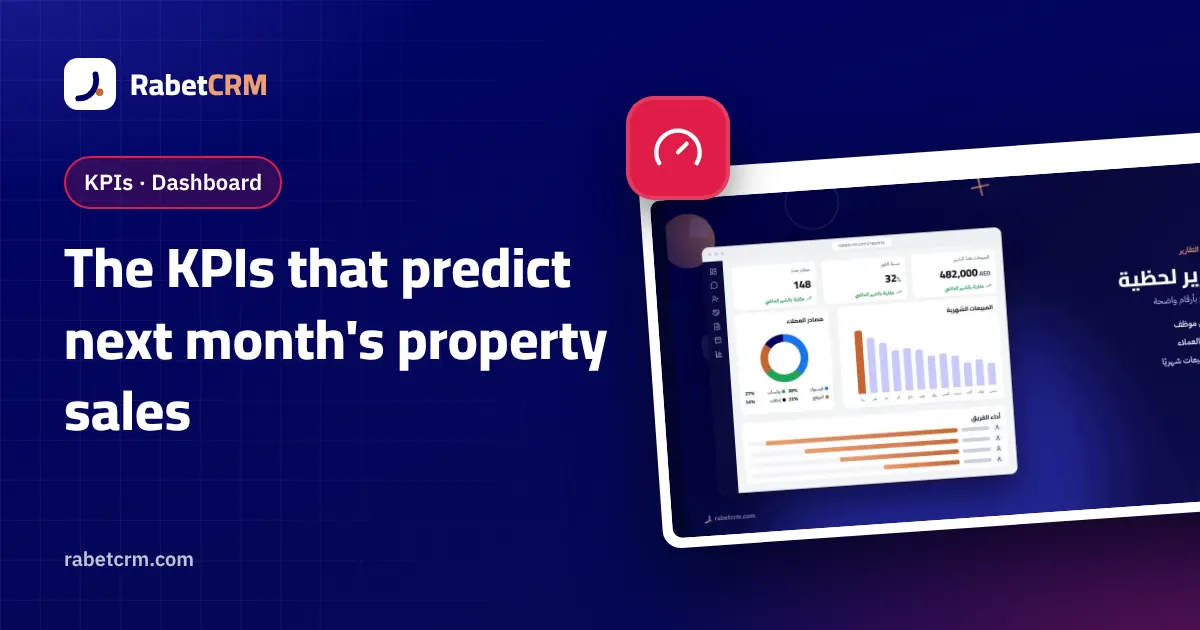
In RabetCRM for real estate you'll find ready reports for most of these numbers: response time per agent, daily team activity with calls, WhatsApp messages and notes, each member's leads, conversion rate, deals won and value, a stage funnel showing how many leads reached each stage such as viewing and offer, lead sources with conversion and won revenue per source, lost reasons, and a commissions report. Reports also list open leads not contacted recently with a button to create a follow-up task, and any view can be exported to Excel. You add each source's cost yourself to work out ROI.
Start a 15-day free trial with no credit card, import your current leads, and review your first performance report with the team at the end of week two.
More articles
Real estate CRM in every emirate
Compare RabetCRM
FAQ
What is the most important KPI for a real estate agent?
No single number is enough, but closing rate from leads received is the best overall measure, while response time and overdue follow-ups are the best early indicators of results to come.
How do I calculate closing rate in real estate?
Divide deals closed by leads received in the same period and multiply by 100. To measure only the final stage, divide deals closed by offers made.
How do I calculate lead source ROI?
Subtract the source's cost from the commission revenue it produced, divide by the cost and multiply by 100. Review it over more than a month, because property deals lag.
How often should agent performance be reviewed?
Check response time and overdue follow-ups daily or weekly, the other numbers in a monthly meeting, and source ROI roughly every quarter.
Should I compare agents directly with each other?
Only if they received leads from similar sources and types. It's better to compare each agent with their own previous months and pick one number to improve each month.